Trouble viewing this article Click Here.
Those with experience in financial investing are already familiar with the saying, “Past performance is no guarantee of future results.” Does this phrase also apply to the prediction of future equipment values?
Iron Solutions, which has a long history in the valuation of agricultural equipment, developed this case study to explore what factors might make historical depreciation a risky forecast methodology.
Dealers, lenders and equipment owners at times need to estimate the future value of a piece of equipment. Lease residuals are the most common reason to develop these predictions, but a variety of other circumstances such as future equipment trade-ins, risk assessment on rental fleet, and inventory also require these calculations.
When making future value predictions, it can be tempting to use past performance as the benchmark for expected future value.
For example, you need to know the value of a 140 hp Tractor three years from now. Here is a common approach to making that estimate:
- Determine the current value of a similar three year old model.
- Calculate the depreciation percentage off its price when new.
- Apply that percentage to your current model to create the desired estimate.
While the above is a common process, its performance as an accurate methodology is rarely studied. Let’s see how that method would have performed based on a test case.
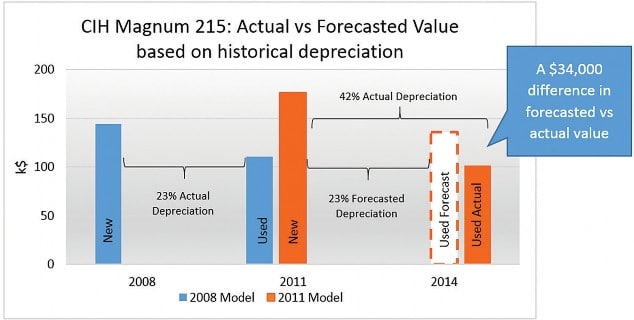
It’s October of 2011, and you need to forecast the value 3 years in the future of a 2011 CIH Magnum 215. New, it’s worth $176,223. A similar model, a 2008, three years ago, new, was worth $144,220 and it’s worth $110,962 at this point in 2011. It depreciated 23% in that period.
You use that depreciation percentage to forecast the value of the new 2011 machine. This forecast number is shown in the chart below as the “Used Forecast” bar in white.
We now know the actual used value of this unit and can compare the actual to the forecast value. In the graph below, we show the original Used Forecast value next to the Used Actual value in 2014.

If you had used historical depreciation to forecast this machine’s value, you would have been off by around $34,000, or 34%.
What caused this discrepancy? The answer lies in a dangerous fundamental assumption of this model, which is: History will repeat itself.
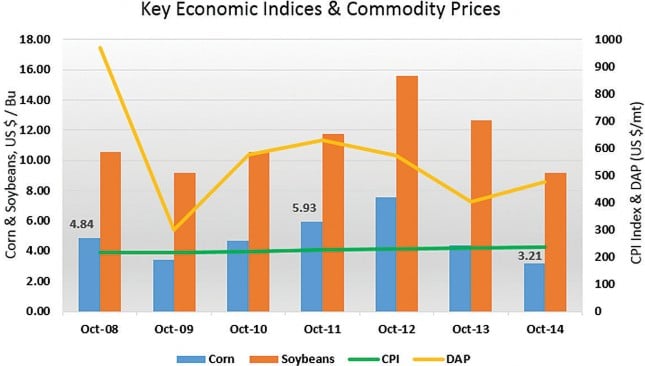
A review of common commodity prices that are important to agriculture, and potentially capable of impacting equipment value, shows some dramatic differences in 2011, the time of the original forecast, versus either 2008 or 2014.

A look at corn prices in this period illustrates the flaw in the historical depreciation model. Corn prices are important because equipment values are impacted by the values of the underlying products that the machines are used to generate. Changes in corn prices can therefore impact depreciation rates. In October of 2008, when our forecast model tractor was new, corn was at $4.84/bushel. In 2011, the year the flawed forecasted value was made, corn was 23% higher at $5.93/bushel. It then fell back in 2014 to $3.21/bushel, -46%.
The 2008 Magnum 215 benefited from the strong corn market of 2011 and did not depreciate as much as the 2011 model, which aged during the less favorable corn market years of 2013 and 2014. The 2011 model was sold new when corn prices (and equipment demand) were higher compared to 2014 when corn had fallen from $5.93 to $3.21. This difference in the corn market partially explains the $34,000 difference in historical forecast from actual.
By combining unique and extensive data sets with state-of-the-art analytics, Iron Solutions is able to identify and estimate the impact that various external factors have on used equipment values.
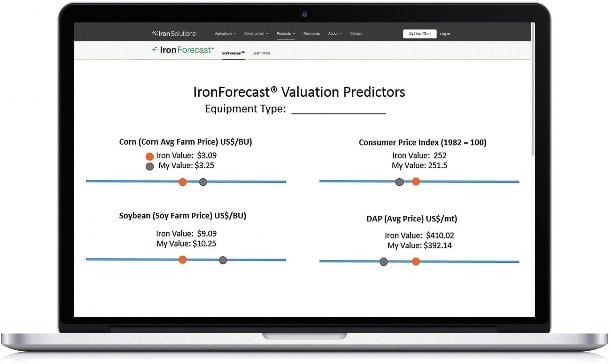
We have built this knowledge into the predictive model used in our IronForecast®. IronForecast can be used to predict the future value of current model year and older used equipment values up to 84 months in the future, for individual units or full inventories. While it incorporates forecasts for key economic indicators from leading econometric firms, it also allows for the user to adjust for local market conditions and custom forecasts. Some examples of these key metrics include commodity prices, the Consumer Price Index or the price of a common fertilizer, Diammonium Phosphate (DAP).

IronForecast displays the appropriate metrics, named Valuation Predictors, by type of equipment and shows the impact of adjustments to these predictors in real time.
